Mapping tool allows users to visualize 2017 BC wildfire devastation
-
Share on Facebook
-
Share on Twitter
- Copy Link
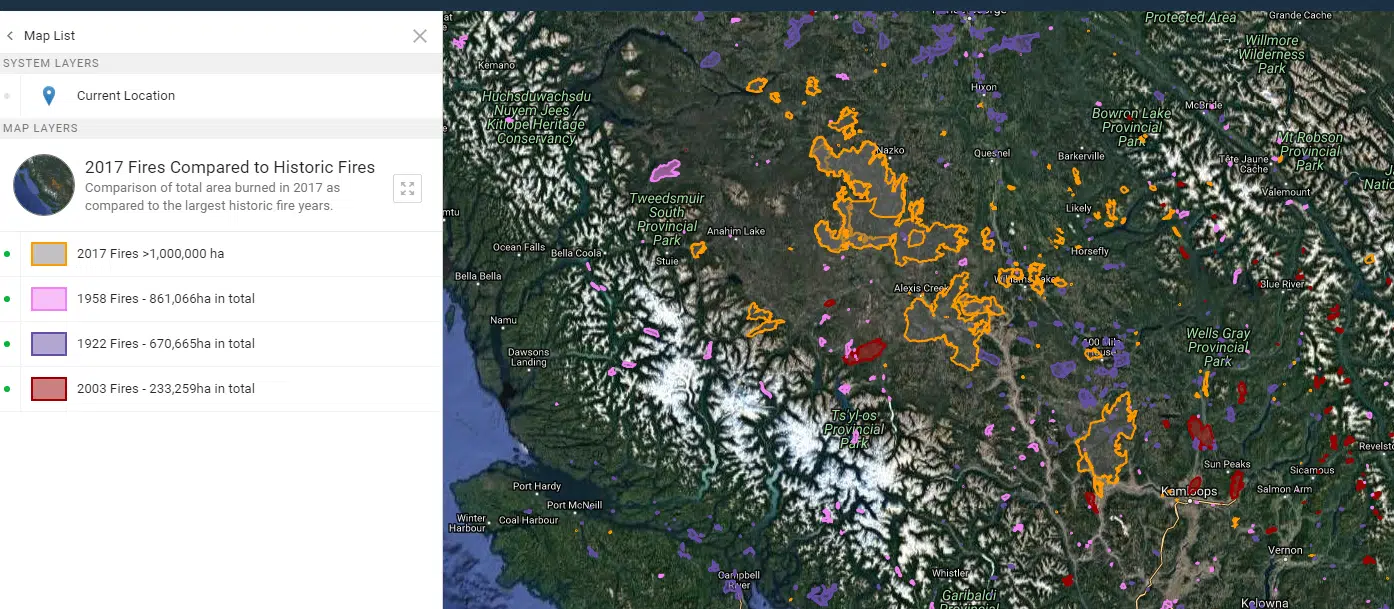
KAMLOOPS — A Kamloops software company has released a mapping tool allowing users to visually compare the record-breaking 2017 BC wildfire season with other noteworthy historical fire seasons.
Lightship’s interactive map compares this summer’s burn area map with the years 1922, 1958 and 2003.
In a release, Lightship CEO Dan Erikson said, “This year’s fire season is unprecedented in multiple ways including the total area burned and the size of individual fires. If you only hear the statistic, it is hard to visualize the differences as compared to other significant years.”
“By visualizing the information on a map, you can immediately see the differences in size and distribution and better understand the current circumstances that make this season unique,” Erikson added.